


Het verschijnen van de maan tijdens een totale maansverduistering in november 2022. NASA heeft een nieuwe kaart uitgebracht met details over zonsverduisteringen in 2023 en 2024 in de Verenigde Staten. Krediet: NASA’s Scientific Visualization Studio
Waar zullen de zonsverduisteringen zijn in 2023 en 2024 in de Verenigde Staten?
Based on observations from several NASA missions, the map details the path of the Moon’s shadow as it crosses the contiguous U.S. during the annular solar eclipse on October 14, 2023, and total solar eclipse on April 8, 2024.

Using observations from different NASA missions, this map shows where the Moon’s shadow will cross the U.S. during the 2023 annular solar eclipse and 2024 total solar eclipse. The map was developed by NASA’s Scientific Visualization Studio (SVS) in collaboration with the NASA Heliophysics Activation Team (NASA HEAT), part of NASA’s Science Activation portfolio. Credit: NASA/Scientific Visualization Studio/Michala Garrison; eclipse calculations by Ernie Wright, NASA Goddard Space Flight Center
These dark paths across the continent show where observers will need to be to see the “ring of fire” when the Moon blocks all but the outer edge of the Sun during the annular eclipse, and the ghostly-white outer atmosphere of the Sun (the corona) when the Moon completely blocks the Sun’s disk during the total eclipse.
Outside those paths, the map also shows where and how much the Sun will be partially eclipsed by the Moon. On both dates, all 48 contiguous states in the U.S. will experience at least a partial solar eclipse (as will Mexico and most of Canada).
Reading the Map
On NASA’s new eclipse map, the paths for the annular eclipse and total eclipse appear as dark bands across the U.S.
Anyone located in the annular eclipse path, from Oregon to Texas, will have a chance to see the annular eclipse if the skies are clear. Anyone located in the total eclipse path, from Texas to Maine, will have a chance to see the total eclipse, weather permitting.

An area of Texas near San Antonio, where the two eclipse paths cross, will experience both the annular eclipse in 2023 and the total eclipse in 2024. Credit: NASA/Scientific Visualization Studio/Michala Garrison; eclipse calculations by Ernie Wright, NASA Goddard Space Flight Center
Inside those dark paths are oval shapes with times inside them (yellow ovals for the annular eclipse, purple ovals for the total eclipse). Those ovals show the shape of the Moon’s shadow cast on Earth’s surface at the times shown. People in the areas inside the ovals will see the annular eclipse or total eclipse at that time.

The Moon’s shadow will move quickly during both eclipses. On the map, ovals within the eclipse paths show the location and shape of the shadow at different times. For example, during the total eclipse on April 8, 2024, the Moon’s shadow will be over Dayton, Ohio, at 3:10 p.m. EDT, but by 3:20 p.m. EDT it will have moved to Buffalo, New York. Credit: NASA/Scientific Visualization Studio/Michala Garrison; eclipse calculations by Ernie Wright, NASA Goddard Space Flight Center
For locations close to the center of the paths, the annular eclipse or total eclipse will last longer than those near the outer edges of the path. Inside each path are white lines that indicate how long annularity or totality will last. For the annular eclipse path, you can find labels (ranging from 3 to 4.5 minutes) near the Nevada-Utah border in the north and between San Antonio and Corpus Christi, Texas, in the south. For the total eclipse path, you can find labels near Presque Isle, Maine, in the north, and between the 2:20 and 2:25 p.m. CST ovals in Mexico in the south.

The closer to the center of the eclipse path, the longer each eclipse will last. On the map, each eclipse path includes white lines that indicate how long that eclipse will last at different locations. For example, the annular phase of the eclipse will last about four minutes near Elko, Nevada, and about four and a half minutes near Richfield, Utah. Credit: NASA/Scientific Visualization Studio/Michala Garrison; eclipse calculations by Ernie Wright, NASA Goddard Space Flight Center
Viewers in locations outside the paths will not experience a total solar eclipse or annular eclipse, but they may still see a partial eclipse. Lines running parallel to each path indicate how much of the Sun will become covered by the Moon during the partial eclipse. For the annular eclipse, these lines appear faint yellow. For the total eclipse, they’re faint purple. Percentage labels for the annular eclipse lines appear along the left and top edges of the map. The percentage labels for the total eclipse appear along the bottom and right edges of the map. (Tip: The percentages appear at the same angles as the lines.)

Outside of the eclipse paths, purple and yellow lines on the map show the percentage of the Sun that will become covered by the Moon at different locations for the total and annular eclipses, respectively. For example, the purple line that passes near New York City and Providence, Rhode Island, indicates that the Sun will become about 90 percent obscured in those cities during the peak of the eclipse on April 8, 2024. Credit: NASA/Scientific Visualization Studio/Michala Garrison; eclipse calculations by Ernie Wright, NASA Goddard Space Flight Center
Neither eclipse will be contained to the contiguous U.S., though. In the lower right corner of the NASA map, a globe shows the full paths for both eclipses. The annular eclipse (in yellow and black) extends into Mexico, Central America, and South America. The total eclipse (in purple and black) also crosses Mexico and northeastern Canada. Shaded bands (yellow for the annular eclipse and purple for the total eclipse) also show where a partial eclipse can be seen. For example, in October 2023, southeastern Alaska will experience a partial eclipse, while Hawaii will have a chance to see a partial eclipse in April 2024.
Making the Map
Michala Garrison, a member of the Scientific Visualization Studio (SVS) at NASA’s Goddard Space Flight Center, applied her background in geography and cartography to design the map, incorporating information from a variety of NASA sources.
Earth elevation information came from the Shuttle Radar Topography Mission, while maps of the Moon’s shape were supplied by Lunar Reconnaissance Orbiter. The positions of the Sun, Moon, and Earth were found using software and data from NASA’s Navigation and Ancillary Information Facility. Garrison’s SVS colleague, Ernie Wright, used all of this information to calculate the location and shape of the Moon’s shadow.

The NASA map includes a globe showing the full paths of the 2023 annular eclipse (in yellow and black) and the 2024 total eclipse (in purple and black). Shaded bands (yellow for the annular eclipse and purple for the total eclipse) also show where a partial eclipse can be seen. Credit: NASA/Scientific Visualization Studio/Michala Garrison; eclipse calculations by Ernie Wright, NASA Goddard Space Flight Center
NASA’s Blue Marble – a global mosaic of satellite images assembled by the NASA Earth Observatory team – provided color for the land. And one particularly unique feature Garrison thought to add along the path of the 2024 total eclipse was nighttime imagery of Earth from NASA’s Black Marble – which shows city lights on the night side of the planet as imaged by the Suomi NPP spacecraft.
One of Garrison’s goals for the map was to inspire people to get to the paths of the annular and total eclipses, which she didn’t do the last time the Moon’s shadow crossed the continental U.S.
Twee zonsverduisteringen zullen de Verenigde Staten doorkruisen in 2023 en 2024. Op 14 oktober 2023 zal een ringvormige zonsverduistering een “ring van vuur” in de lucht creëren van Oregon tot Texas. Op 8 april 2024 zal een totale zonsverduistering de lucht van Texas tot Maine verduisteren. Op beide data zullen alle 48 aaneengesloten staten in de Verenigde Staten een gedeeltelijke zonsverduistering meemaken. De kaart, ontwikkeld met behulp van gegevens van verschillende NASA-bronnen, toont zowel eclipssporen als donkere banden. Buiten deze paden geven gele en violette lijnen aan hoeveel de maan tijdens een gedeeltelijke zonsverduistering voor de zon zal blokkeren. Deze video zoomt in op verschillende delen van de kaart en toont deze en andere kenmerken die beschrijven wat waarnemers in het hele land kunnen verwachten tijdens elke zonsverduistering.
“In 2017 was ik in Maryland, dus ik moest een beetje zien, omdat ik in een gedeeltelijke zonsverduistering was”, zei ze. “Maar daar wist ik toen nog niets van. Het zorgt ervoor dat ik bijvoorbeeld in 2023 naar Albuquerque wil gaan. En dan in 2024 om meer naar het zuiden te gaan.”
Garrison heeft verschillende herzieningen doorgevoerd om te proberen de kaart zowel esthetisch als functioneel te maken, om mensen zowel op als buiten de paden te helpen bij het plannen van hun eclipservaring.
“Het kostte veel vallen en opstaan. Ik wilde dat het nuttig zou zijn voor de lezer, maar niet overweldigend – en toch een geweldig product om naar te kijken om de aandacht van mensen te trekken.”

“Bierliefhebber. Toegewijde popcultuurgeleerde. Koffieninja. Boze zombiefan. Organisator.”
More Stories
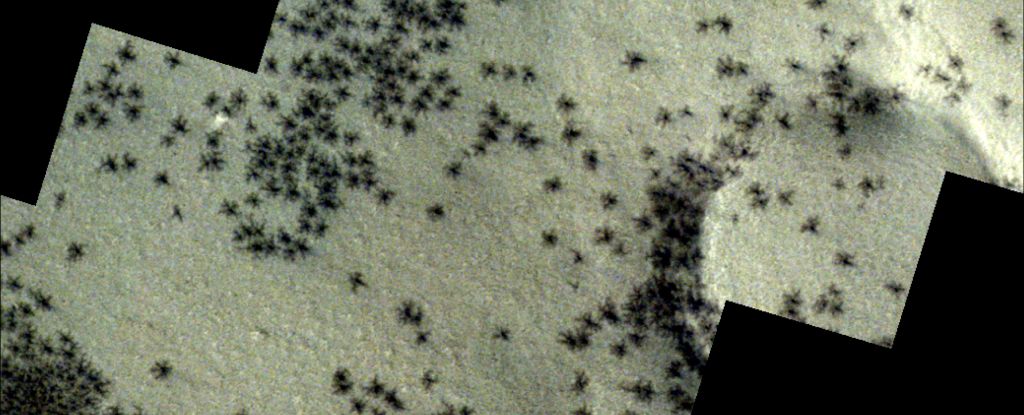
Vreemde spinnen verspreidden zich in verbazingwekkende foto's in de Inca-stad op Mars
Cambridge-wetenschappers onthullen een nieuwe theorie over de oorsprong van de bouwstenen van het leven
Hubble viert zijn 34e verjaardag met een prachtig zicht op de Kleine Halternevel